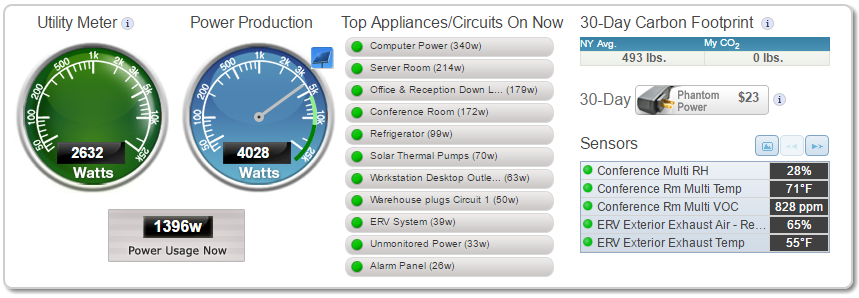
Figure 1. SiteSage shows live information for this building's energy use, top circuits, and air quality conditions. Currently, this building is using 1396 watts and generating 4028 watts through solar. The net of the energy use and solar is 2632 watts, which is being sent back to the grid. The dashboard also displays carbon footprint and phantom power.
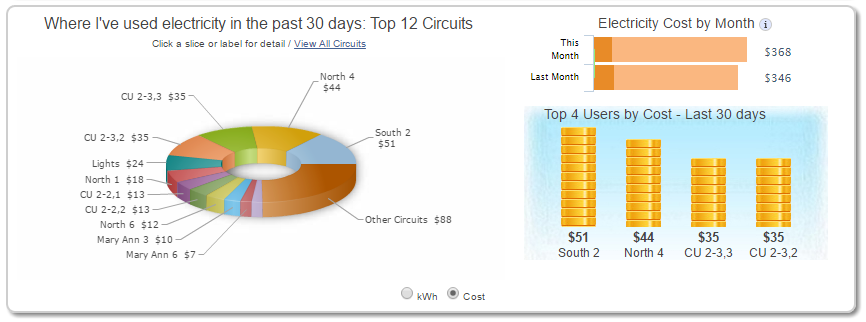
Figure 2. SiteSage charts the top circuits over the past 30 days. The radio button allows the chart to display kWh or costs. Plus, the software compares electricity costs this month vs. the prior month.
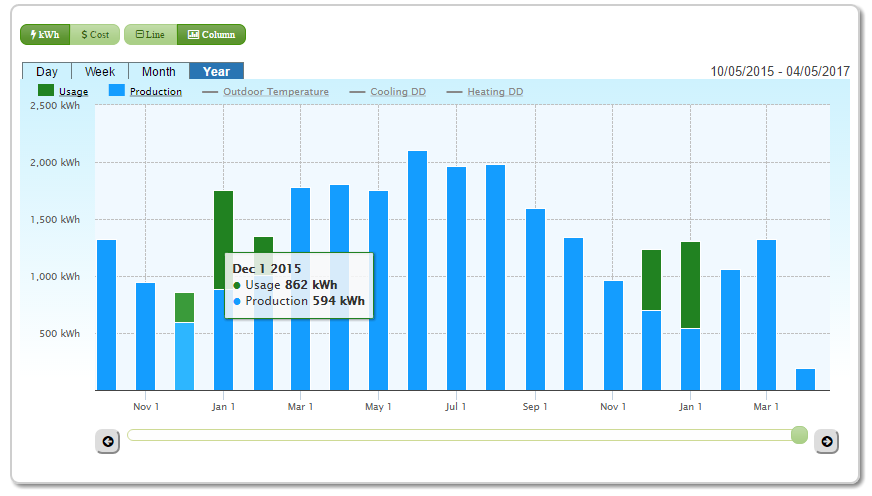
Figure 3. This chart shows energy use and production over many different time frames. Correlate energy use against outside temperature data. Here, temperatures are pulled from the Internet. The chart can show kWh or costs, as well as degree days for heating and cooling.
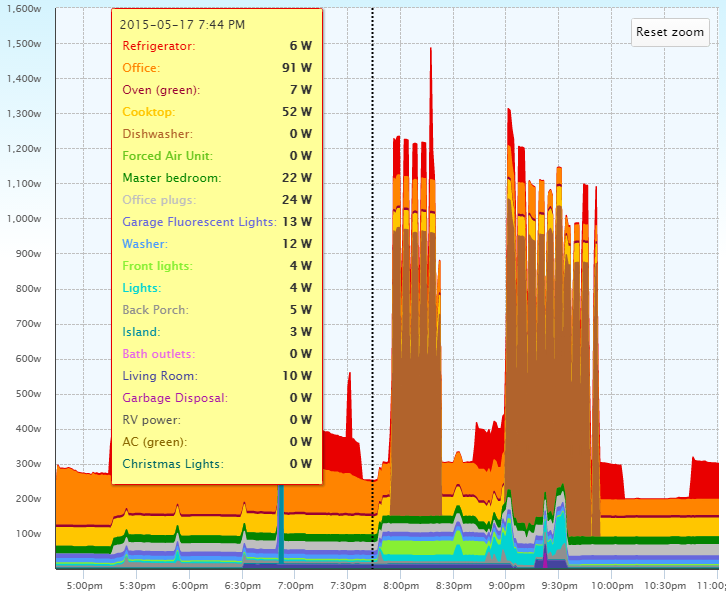
Figure 4. This chart shows what circuits contribute to overall electricity use. Easily zoom in on a smaller time frame. Or toggle the circuits being charted to simplify the display.
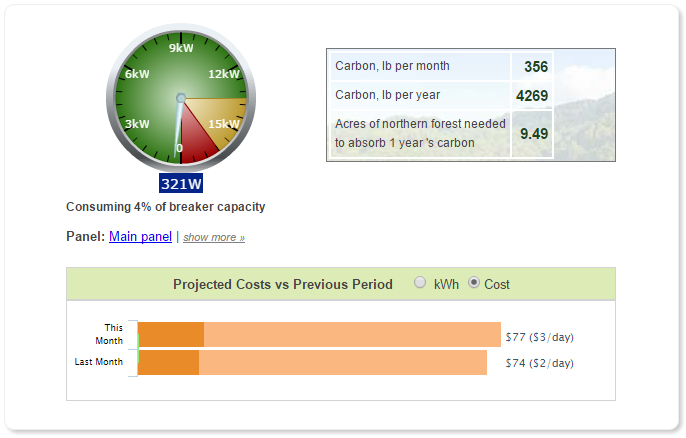
Figure 5. SiteSage has a page for each equipment / circuit being monitored. Here is the current use, as well as costs for this month vs. last month. Carbon calculations are also provided.
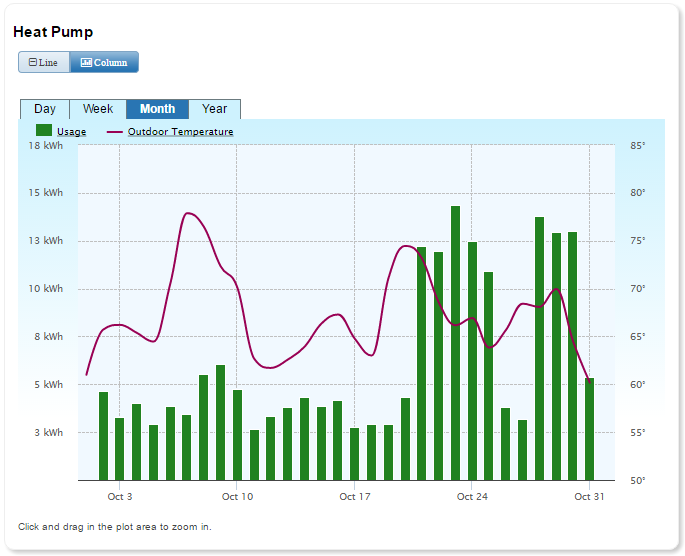
Figure 6. SiteSage also charts runtimes for each circuit. Easily view minute-by-minute detail, or view the data on a daily or monthly time frame. Correlate equipment runtimes against outdoor temperatures or sensors integrated with SiteSage.
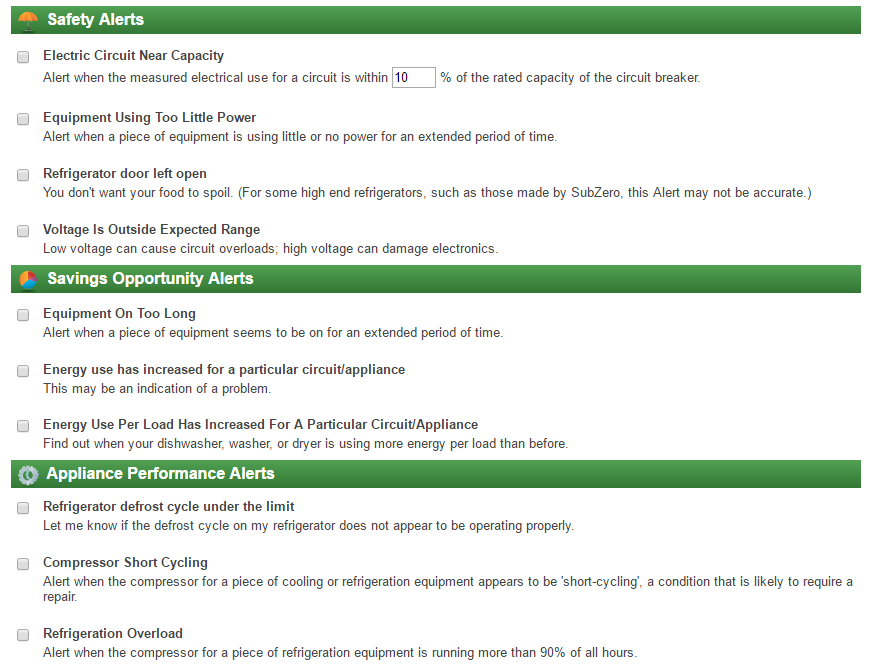
Figure 7. SiteSage can send email and text alerts for budget, safety, and performance. Many of these alerts are specific to equipment being monitored.
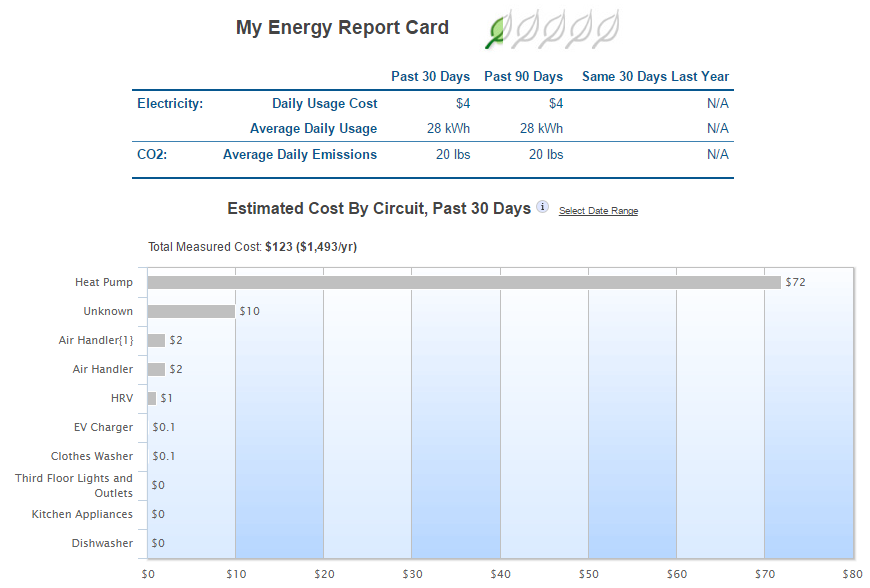
Figure 8. SiteSage can show show costs by circuits. The software compares the past 30 days against the past 90 days and the same 30 days in the previous year. Easily adjust the time frame for a different perspective. Export the data to excel for additional analysis. API access is available upon request.
SiteSage shows live information for this building's energy use, top circuits, and air quality conditions. Currently, this building is using 1396 watts and generating 4028 watts through solar. The net of the energy use and solar is 2632 watts, which is being sent back to the grid. The dashboard also displays carbon footprint and phantom power.
SiteSage charts the top circuits over the past 30 days. The radio button allows the chart to display kWh or costs. Plus, the software compares electricity costs this month vs. the prior month.
This chart shows energy use and production over many different time frames. Correlate energy use against outside temperature data. Here, temperatures are pulled from the Internet. The chart can show kWh or costs, as well as degree days for heating and cooling.
This chart shows what circuits contribute to overall electricity use. Easily zoom in on a smaller time frame. Or toggle the circuits being charted to simplify the display.
SiteSage has a page for each equipment / circuit being monitored. Here is the current use, as well as costs for this month vs. last month. Carbon calculations are also provided.
SiteSage also charts runtimes for each circuit. Easily view minute-by-minute detail, or view the data on a daily or monthly time frame. Correlate equipment runtimes against outdoor temperatures or sensors integrated with SiteSage.
SiteSage can send email and text alerts for budget, safety, and performance. Many of these alerts are specific to equipment being monitored.
SiteSage can show show costs by circuits. The software compares the past 30 days against the past 90 days and the same 30 days in the previous year. Easily adjust the time frame for a different perspective. Export the data to excel for additional analysis. API access is available upon request.
| GET QUOTE |